Page 15 - Engilish 2015 Annual Report
P. 15

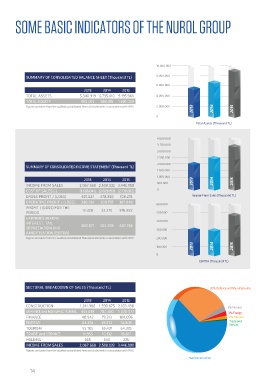
SOME BASIC INDICATORS OF THE NUROL GROUP                                                                                SOME BASIC INDICATORS OF THE NUROL GROUP


                                                                      10.000.000

             SUMMARY OF CONSOLIDATED BALANCE SHEET (Thousand TL)      8.000.000                                                      INVESTMENTS (Thousand TL)
                                                                                                                                                                                              1. 400.000
                                                                      6.000.000
                                      2013     2014    2015                                                                                                    2013    2014     2015          1.200.000
             TOTAL ASSETS           5.340.919 6.735.410 9.195.944     4.000.000                                                      OTOYOL A.Ş. INVESTMENT  507.226  715.878  737.398        1.000.000
             TOTAL EQUITY            990.072  983.915  1.601.003                                                                     PROPERTY, PLANT AND                                      800.000
                                                                                       2013     2014     2015                        PROPERTIES                                               600.000
             Figures are taken from the audited consolidated financial statements in accordance with IFRS.  2.000.000                EQUIPMENTS & INVESTMENT  187.594  152.846  166.643
                                                                      0                                                              ENERGY INVESTMENTS       119.746   16       0            400.000
                                                                                        Total Assets (Thousand TL)                   MINING INVESTMENTS       12.368  109.336  27.938         200.000          2013     2014     2015
                                                                                                                                     OTHER INVESTMENTS        4.810    10.170  9.502
                                                                                                                                                                                              0
                                                                                                                                     TOTAL                   831.744  988.246  941.481
                                                                       4.000.000                                                     * Figures are taken from the audited consolidated financial statements in accordance
                                                                                                                                        with IFRS.                                               Otoyol A.Ş. Investment - Property, Plant And Equipments &
                                                                       3. 500.000                                                    * Investments represent realizations in the current period.     Investment Properties - Energy Investments
                                                                       3.000.000                                                     * Otoyol A.Ş.'s investment is taken from the independent auditor's report of Otoyol      Mining Investments - Other Investments
                                                                                                                                        Yatırım ve İşletme A.Ş. prepared in accordance with IFRS as percentage of Nurol shares
                                                                       2.500.000                                                        (26,98%).
                                                                                                                                     * Land and construction investments realized for Nurol Real Estate's ongoing residential
                                                                       2.000.000                                                        construction projects are excluded. The cumulative investment amount is 1.166.961
             SUMMARY OF CONSOLIDATED INCOME STATEMENT (Thousand TL)                                                                     thousand TL for the ongoing three projects as of 2015.
                                                                       1.500.000                                                     * Sell and Leaseback transactions for investments are excluded.
                                                                       1.000.000
                                      2013     2014    2015                                     2014     2015
                                                                       500.000         2013
             INCOME FROM SALES      2.067.668 2.508.022 3.446.900
             COST OF SALES (-)      (1.666.041) (2.029.193) (2.738.682)  0
             GROSS PROFIT / (LOSS)   401.627  478.829  708.218                        Income From Sales (Thousand TL)
             OPERATING PROFIT / (LOSS)  230.134  209.797  367.840     600.000                                                                                                                 1. 400.000
             PROFIT / (LOSS) FOR THE                                                                                                 EXPORT SALES (Thousand TL)                               1.200.000
             PERIOD                   12.328  22.270  576.822         500.000
             EARNINGS BEFORE                                                                                                                                                                  1.000.000
             INTEREST, TAX,                                           400.000                                                                        2013    2014     2015                    800.000
             DEPRECIATION AND        309.871  304.978  487.746        300.000                                                        CONSTRUCTION  344.587  661.422  756.833
             AMORTISATION (EBITDA)                                                                                                   OTHER         280.936  287.410  429.691                  600.000
             Figures are taken from the audited consolidated financial statements in accordance with IFRS.  200.000                  TOTAL         625.523  948.832  1.186.524                400.000
                                                                                       2013     2014     2015                        Figures are taken from the audited consolidated financial statements   200.000
                                                                      100.000                                                        in accordance with IFRS.                                                  2013     2014     2015
                                                                                                                                                                                              0
                                                                      0
                                                                                                                                                                                                                   Construction - Other
                                                                                          EBITDA (Thousand TL)


             SECTORAL BREAKDOWN OF SALES (Thousand TL)                                        30% Defence and Manufacturing

                                      2013     2014    2015
             CONSTRUCTION            1.241.988 1.590.675 2.169.490                                    3% Finance                     HUMAN RESOURCES
             DEFENCE and MANUFACTURING  653.639  702.360  1.020.077                                    2% Energy
             FINANCE                 40.942   79.313  104.096                                          2% Tourism
             ENERGY                   63.374  59.572  74.809                                           Trade and                                               2013    2014     2015
                                                                                                       Service
             TOURISM                  55.105  65.431   64.376                                                                        NUMBER OF PERSONNEL      11.737  11.780   13.269
                                                                                                                                     Figures are taken from the audited consolidated financial statements in accordance with IFRS.
             TRADE and SERVICE        11.955  10.132   13.817
             HOLDING                   665     540      235
             INCOME FROM SALES      2.067.668 2.508.022 3.446.900
             Figures are taken from the audited consolidated financial statements in accordance with IFRS.
                                                                                     %63 Construction

              14                                                                                                                                                                                                                15
   10   11   12   13   14   15   16   17   18   19   20